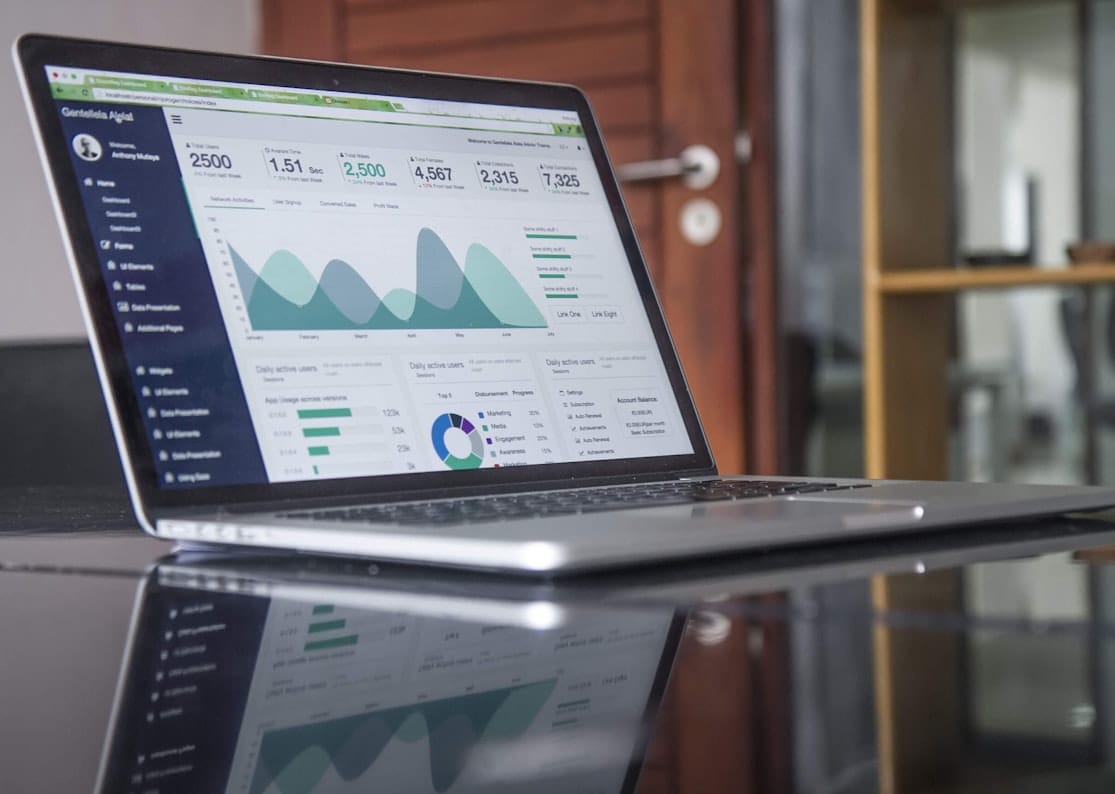
In the rapidly evolving digital world of today, data is the key factor that will help businesses sustain their growth. Depending on old-fashioned manual reporting or spreadsheets, which are too complicated, makes it hard for one to adapt to changes in the market environment. A contemporary and well-structured analytics dashboard helps address this issue by converting data points into insights that can be easily accessed from a single point.
Real-Time Data Visualization
Use of visual tools, like graphs and charts, helps convert data points into easily understandable insights. Teams will be able to track user activity and performance of different systems through a single look.
Efficient Financial and Metrics Tracking
The process of tracking metrics such as conversions on an ongoing basis and revenue metrics can be made easy using dashboard automation tools. Early identification of any changes to the cash flow, budgetary issues, and performance decline allows avoiding extra spending and optimizing finances.
Data-Driven Decisions
Having all information collected into one picture makes it easier to overcome information silos in departments. Regardless of whether you track active users, adoption rates, or marketing channel returns, having real-time data available is essential to make proper decisions in the long term.
Having efficient data visualization and automated tracking is no longer an option but a necessity.
finance
The Strength of Live Data Analytics Dashboards in Business and Financial Development
Learn more about the ease of monitoring finances with the use of analytical dashboards that turn data into insights.